Commercial offshore construction and activities require high quality bathymetry data and data products. EMODNet has developed useful services that provide access to bathymetry datasets and Digital Terrain Models (DTM). This page demonstrates how to extract and calculate data products from the EMODnet Bathymetry Portal.
EMODnet Bathymetry Viewing & Download portal
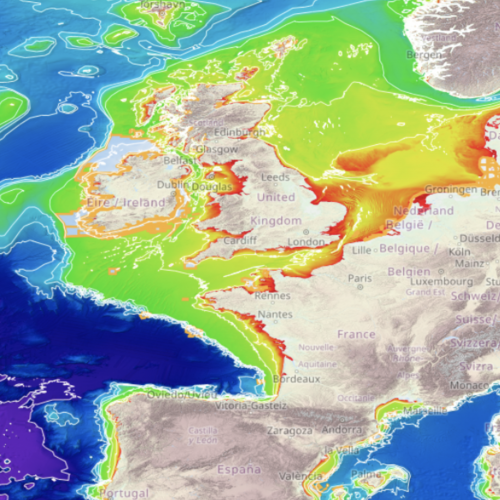
The bathymetry viewing & download portal gives access to different bathymetry-related layers such as depth contours or a mean depth rainbow color ramp. These layers can be downloaded for a certain grid, an area of interest or for high resolution areas for all regions in the world. Digital terrain models can be viewed at high resolution (1/16 * 1/16 arc minutes) for European seas. These viewing services allow the user to zoom in, retrieve depths and depth profiles for certain areas as well as their associated metadata.
Bathymetry viewing & downloading service
Create bathymetry maps in R
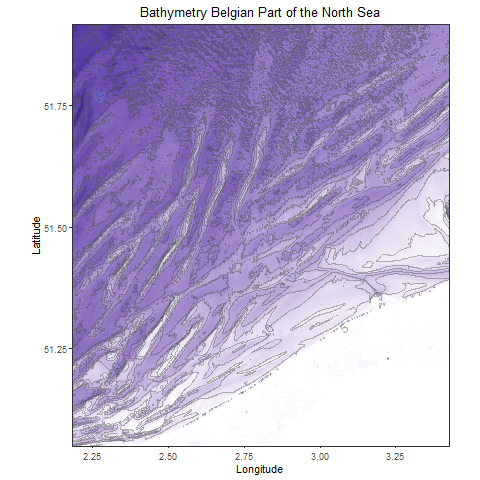
An R script created by EMODnet enables the user to make bathymetry maps of their preferred area in an easy and quick way. Two-dimensional and three-dimensional maps can be made using the script below. In the picture above, a bathymetry map of the Belgian part of the North Sea was made with the following R script. In order to create a map of the preferred area, the maximum and minimum latitude and longitude coordinates are needed.
EMODnet Bathymetry Consortium (2018): EMODnet Digital Bathymetry (DTM) http://doi.org/10.12770/18ff0d48-b203-4a65-94a9-5fd8b0ec35f6